|
This section allows you to view all posts made by this member. Note that you can only see posts made in areas you currently have access to.
Messages - firebreathz
31
« on: March 26, 2020, 12:12:03 am »
32
« on: March 22, 2020, 12:45:45 pm »
Access to all global markets from a single account. Indices, Cryptocurrencies, CFDs on stocks, Forex, and ETFs. ... The netting and hedging position accounting models are available. Multi-asset terminal R Trader combines cutting-edge technologies and a classic design taken to a completely new level. No more unnecessary software and updates get access to all global financial markets via a web terminal in a familiar web browser. Free Automated Strategy Builder The unique tool in R Trader terminal, which will allow you to build, run, and test your trading strategies. You will have an opportunity to create efficient trading algorithms with uncomplicated features and functionality to help you to reduce manual trading time. Using the strategy builder requires no programming skills or knowledge. R Trader
33
« on: March 17, 2020, 07:23:10 pm »
Forex is simple and very complicated at the same time. When people first start, so many stumble by misunderstanding a couple of things that because of the wording and layout that are way too easy to overlook
Most know to buy low and sell high, which is correct but because of the setup in forex this leads to a far too common mistake that confuses people that have just started and or goes completely unnoticed... Let me explain
On what ever chart you have decided to start on there will be two buttons
BUY & SELL
So many will press the Buy button when the chart is at a low point... (All good so far)
Wait for the price rise into profit and then they will press Sell..
Most new people will assume they have bought and then sold..
In forex the setup is different
If you press buy and then after it rises press sell you will have two open trades..
Instead
You want to open a buy position when the chart is low and after its risen and gone into profit you want to Close that trade..
And when the chart is high you want to open a sell position and after the chart fallen and gone into profit you then want close that trade
also by default there is only one line on the mt4/5 chart to show the current price if you right click the chart and click properties and the click show ask price so both ask and bid are ticked you will have 2 price levels that will help you trade more accurately
35
« on: December 12, 2019, 06:41:29 pm »
Pretty much everyone who has programmed a computer to do anything beyond outputting Hello World has dreamed of having a computer algorithm (algo) working tirelessly to extract money from the financial markets, be it in stocks, bitcoin, soybeans or anything else traded on an exchange. Programming genius, market slayer is a phrase wed all like to be associated with. That is what a good algorithmic trader is. But how realistic is creating and deploying a computerized algo bot, or an army of bots, to make money for you? And, assuming it can be done, how do you actually go about doing it? This guide walks you through the steps to becoming successful at algo trading. But be warned it is much more involved and much more difficult than you might think. The Basics What Are We Actually Talking About? Before we get too far, there is some terminology involved in trading that will help you understand algo trading. There are 3 primary modes of trading. The first is discretionary trading, where a trader makes buy/sell decisions based on any number of factors, some of which can be programmed, and others such as intuition and hunches which cannot. Many discretionary traders stare at charts or price ladders on a computer screen for hours at a time, buying and selling as they go along. The second type of trading is algo trading. In years past, it was called mechanical, systematic, black box or rule based trading. Now most people refer to it as algorithmic or algo trading, but the idea has not changed. The core philosophy is that all the rules for buying and selling (the trading system or trading strategy) are 100% defined, and strictly followed. This makes algo trading ideal for a computer to execute, and even run automated in real time without human intervention. One huge benefit of this style of trading is the rules can be historically tested, known as a "backtest." By running a backtest, you can gain confidence in a trading algo before putting money behind it. If the rules were not profitable in the past, they likely wont be in the future! The third type of trading combines discretionary and algo trading. This is known as a hybrid or gray box approach. For example, maybe the entries are based on a traders intuition, with only the exit rules computerized. For the discussion below, we will concentrate on the second approach pure algo trading - 100% computerized rules for buying and selling any instrument. We will look to algo trade on an exchange, which is just a physical or virtual setting where buyers and sellers can execute trades. Why Should You Listen To Me? Now that we have basic terms down, you might be wondering why you should listen to me. First, I have been algo trading for over 25 years, and most importantly, not always successfully. Over the years, I have learned and overcome the pitfalls in trading system design that plague many traders. This took years of hard work and tuition (losses) paid to the market. But eventually, I was able to make a go of algo trading, and finished in 1st or 2nd place 3 years in a row in a worldwide, real money futures trading contest, earning over 100% in each of those years. I was also able to achieve the goal that tantalizes so many part-time hobby traders - making the leap to full time trading, which I still do today. Along the way, I wrote 3 best selling algo trading books, and I share my experiences around the world through workshops, classes and conferences. So, along with my early trading failures, I have had verified trading success. That is important, since many trading educators have never even traded successfully! The process I lay out later in this article is truly from someone who has been there, and done that. Software Requirements When personal computers first came on the scene, the software choices for programming trading systems were minuscule. In todays world, however, the opposite is true. There are so many choices it is hard to decide what to use. A great article on Hackernoon describes some excellent choices: https://hackernoon.com/9-great-tools-for-algo-trading-e0938a6856cd. Another route you can go is to purchase a retail trading platform, such as Tradestation, Multicharts, or NinjaTrader. For many traders, these platforms work perfectly well, and do everything a trader needs to do.  Bitcoin Chart, from Tradestation Trading Platform Of course, some programmers will want to program their own backtesting and execution platform that is what I did 20 some years ago, before I realized it was better in the long run to just use an established platform (I have used Tradestation for over 15 years. Full disclosure: I have a rebate program with Tradestation for attendees of my workshop). With all the excellent computer trading tools and packages out there, I do not recommend this total do it yourself approach. Skills Every Algo Trader Needs To be a successful algo trader, you must have a few essential skills. First, you should be able to trade, or at least know the basics of trading. Do you know what a stop order is? Or limit order? Do you know the margin requirements for the market you want to trade? Is the exchange where you are trading regulated? Questions like this are important. For example, it is critical you realize the risk inherent in unregulated exchanges. Do you know specifics of the instrument you want to trade? For example, if you trade live cattle futures, do you know how to avoid having 40,000 pounds of live cattle delivered to your front yard? I doubt it has ever happened to a trader, but it is certainly possible. The more you know about trading in general, the easier the algo trading process will be. A second skill is being good at math. You should have a good understanding of financial calculations, basic statistics and computing trading performance metrics. A related skill is being good with Excel or other data manipulation software such as Matlab. You will be using such software a lot to supplement your trading strategy analysis, so the better off you are at math, the better you will be at algo trading. The third important skill is to know how to run your chosen trading platform. This seems like a basic skill, but I always tell traders that they should keep learning their platform until they can fool it i.e., they can create trading systems that exploit weaknesses in the platforms backtest engine. By being skilled enough to trick the software, you can avoid many rookie and intermediate level mistakes. Being able to follow an established scientific approach to trading system development is a third skill every good algo trader has. To create solid trading systems, you have to have a sound process for designing, developing and testing your algo strategies. It is not as simple as just programming and trading. If you do not have the skills or ability to follow a set process, algo trading might not be for you. The final skill you need to have algo trading success is arguably the most important - programming ability. Remember a while back when I discussed trading software? Well, a key part of knowing which piece of software to use is knowing your programming abilities. Different platforms require different programming abilities, with some platforms requiring C++ type programming skills, while others might only require drag and drop visual programming skills. The key is to be proficient in whatever programming language is required.  Code For Simple Algo Trading System Successful algo traders program hundreds or even thousands of trading systems over the course of a year. That is because most trading systems are worthless they lose money in the long run. Can you imagine paying someone to program worthless strategies for you? I sure cant! So, programming ability is well worth your time if you want to be a successful algo trader. What Not To Do in Algo Trading Before I discuss a solid, proven process to developing profitable algo trading systems, it is worth pointing out some of the things NOT to do. Almost every new algo trader falls into these pitfalls, but with a little forewarning, you can easily avoid them. Speaking from personal experience, steering around these traps will save you a lot of money. First, since many algo traders have programming, science and math backgrounds, they believe that their models need to be complicated. After all, financial markets are complex beasts, and more trading rules and variables should be better able to model that behavior. WRONG! More rules and variables are not better at all. Yes, complicated models will fit historic data better, but financial markets are noisy. Many times, having a lot of rules just models the noise better, not the actual underlying market signal. Most professional algo traders have simple models, since those tend to work the best going forward on unseen data. Once a trading system model is complete, the second pitfall becomes an issue: optimizing. Just because you have variables (such as moving average lengths, or overbought/oversold thresholds) that could be optimized does not mean they should be optimized. And just because your computer can run a million backtest iterations an hour does not mean you should. Optimizing is great for creating awesome backtests, but remember most of the market data is just noise. A trading strategy optimized for a noisy historical price signal does not translate well to future performance. A third pitfall is related to the first two pitfalls: building a great backtest. When you are developing an algo system, the only feedback you get on how good it may be is via the historical backtest. So naturally most traders attempt to make the backtest as perfect as possible. An experienced algo trader, however, remembers that the backtest does not matter nearly as much as real time performance. Yes, a backtest should be profitable, but when you find yourself trying to improve the backtest performance, you are in danger of falling into this trap.  Improperly Built Trading Systems Usually Perform Poorly in Real Time A fourth and final algo trading pitfall is the too good to be true trap. Be wary of any historical result that just looks too good to be true. Chances are it wont perform nearly as well going forward, it if performs at all. Almost every algo trader I know has developed at least one Holy Grail trading system, one with historical performance that would astound any investor or trader. But almost without exception, those great strategies fall apart in real time. Maybe it was due to a programming error, over-optimization or tricking the strategy backtest engine, but having a healthy dose a skepticism at the outset keeps you away from strategies like this. A Proven Process For Developing Algo Trading Systems Once you avoid the common pitfalls in algo trading, it is time to develop strategies in a controlled, repeatable process. I call my process a Strategy Factory, where trading ideas come in as raw material, machines turn ideas into fully tested strategies, and what leaves the factory is either a tradable strategy or a discarded scrap strategy. The steps I use to create a strategy are given below. The process starts with goals and objectives. Like driving a car to a destination, you have to know where you want to end up before you begin. Identify the market you want to trade, and also the annual return and drawdown you desire. You can have more goals than that, so that is really the bare minimum. Having solid goals and objectives will help you know when you should be satisfied with the trading algo you created, and will help you avoid many of the pitfalls described earlier. Next, you need an idea to build a strategy with. This does not mean you need to develop a whole economic theory for your strategy, but it also means that randomly generating ideas (such as: buy if the close of 53 bars ago is greater than the close of 22 bars ago) probably will not work. The best ideas have an explanation behind them. For example, price moving up tends to keep moving up might be a good idea to code and turn into a strategy. The nice thing is ideas are everywhere, and you can simply modify the ideas you find, tailoring them to fit your desires. Final note: always be on the lookout for trading ideas. You will need to test a lot of them to find a good one. The next step is to historically test your strategy. I usually run this as two separate steps. First, I run a small scale test over a few years of data, to see if my strategy has any merit. Most strategies fail this step, so it saves me the time and aggravation of a full scale test. I also modify the strategy at this point, if I need to. I can do this without fear of overfitting or curvefitting the strategy to the historical data, since I am only using a few years of data. Once I have a successful initial test, I then do a more in-depth test. I use a process called walkforward testing, which is superior to a traditional optimized backtest. You could also do out of sample testing at this point. The key is not to test too much during this step. The more testing you do, the more likely your model is going to be curve or overfitted. After I have a successful walkforward test, I run some random Monte Carlo simulations with my model, to establish its return to drawdown characteristics. You want to have a trading system that provides an acceptable return to drawdown ratio otherwise why trade it? The flip side, though, is that if the return/drawdown is too good, it generally indicates a trading strategy that has been overfit (discussed earlier as a too good to be true trading system). With historical backtesting completed, I now watch the trading strategy live. Does it fall apart in real time? Many poorly built strategies do. It is important that you verify that the trading system still performs well in the real time market. That makes this step very important, even though it is extremely difficult to do. After all, who wants to spend months watching a trading system they just created, rather than actually trading it? But patience is key, and trust me when I say doing this step will save you money in the long run. The final hurdle before turning the strategy on is to examine and compare it to your existing portfolio. At this point, you want to ensure that your strategies have low correlation with each other. Excel or other data analysis software is ideal for this task. Trading 5 bitcoin strategies simultaneously is pointless if they are highly correlated. The idea behind trading multiple strategies is to reduce risk through diversification, not to concentrate or magnify it. Of course, at the end of development, if the strategy has passed all the tests, it is time to turn it on and trade with real money. Usually, this can be automated on your computer or virtual private server, which frees you up to develop the next strategy. At the same time, though, you need to put checks in place to monitor the live strategies. This is critical, but thankfully it is not a cumbersome chore. Knowing when to turn off a misbehaving algo strategy is an important part of live trading. Where Do You Go From Here? If you have made it this far, you certainly now have the basics to get started in algo trading. But whats next? The first step is to decide if algo trading is really something you want to jump into. Assuming you have the programming skills, you also need the desire. Dont do it because you have dollar signs in your eyes. Do it for the challenge of cracking the markets code. Dont try to force yourself to algo trade if it does not feel appropriate. Good trading means not forcing things your trading should fit your personality, skills and abilities. Next, if you have not already, select a trading platform, learn to program strategies with it, and start developing some simple trading algos. Examine sample algos, and try to modify them. Hands on experience with programming trading systems is key, so start as soon as you can. Become as proficient as you can with the trading software and programming of strategies. There are a few right ways to develop an algo trading system, and many more wrong ways. Ive already shared some of the good ways, and also some of the bad ways. You might want to take some time, do some research, and search out experts in algo trading who share their methods. Just watch out, as most educators are charlatans who only trade on a simulator. Ask for student references, look for independent verification of trading results, etc. Be skeptical your algo career depends on doing things correctly, and learning from the correct teacher. Of course, you could learn to algo trade the way I did: 1. Program an algo, test minimally 2. Trade it live with real money 3. Lose money when incorrectly built algo falls apart 4. Tell yourself it will be different next time 5. Start over at step 1. On second thought dont do it the way I did it is way too expensive! The next step, once you have a trading system you feel good about, is to take the plunge and trade on a small scale with real money. Trading with real money changes things. I know a lot of simulated trading millionaires, but very few real money trading millionaires. While it is good to start trading with real money, dont trade too early in your algo career, especially if you have limited trading capital. Many traders fall into this trap, and blow out their accounts before they really understand what is going on. The markets will always be here, but you cant participate unless you have trading capital.  Risk Of Ruin Becomes Extreme For Small Accounts (Results for a Sample Algo) The final step, once you have developed some trading systems and commenced live trading, is to review your performance and improve. Be honest with yourself. If trading is not going well, ask yourself what you can do to improve. It might be changing your development process, or your position sizing approach, or even just trading different markets. The key is you should constantly be looking to get better. After all, there are tons of new algo traders trying to beat you. A Final Thought To sum up, keep in mind that algo trading is hard. Being a great programmer is only part of the puzzle. But with the right skills, desire and development process, becoming successful at developing algo trading systems is definitely possible. source: https://hackernoon.com/the-ultimate-guide-to-successful-algo-trading-15r31fl
36
« on: October 11, 2019, 12:57:45 pm »
Cryptohopper launches two brand new types of bots: the Market Maker and Market/Exchange Arbitrage Bot. Cryptohopper works against the clock to bring its users closer to complex trading methods in a very user-friendly way, like algorithmic and arbitrage trading. That makes it very easy for everyone to design automated trading strategies that run tirelessly 24/7. The Cryptohopper arsenal of trading features hasnt stopped growing during the last years, and today they are rolling out two of their biggest weapons: the Market Making and Market/Exchange Arbitrage bot. They are two brand new types of bots that widen the possibilities of their users Hopper to face the cryptocurrency market. Making them more prepared than ever before. Market making consists of trading the difference between the bid (buy price) and the ask (sell price), also known as the spread. The market-making bot will continuously trade the spread of any market that is chosen. Select the market, and the market making bot will do the rest. But thats only the tip of the iceberg. Cryptohopper has improved the Arbitrage feature to the point where it has become an independent bot. The brand new Arbitrage bot will look for market inefficiencies in any exchange to trade them incredibly rapid and pocket small percentages. Highly requested by users, the platform is proud to be the first trading platform that has developed an Inter-Exchange Arbitrage bot. Only with Cryptohopper, users will be able to take advantage of the big price differences between exchanges. A trading method that has proved to be incredibly effective in the crypto market. Cryptocurrencies are highly volatile. One can be sure these inefficiencies will happen, and the Arbitrage bot feels like a fish in the water among them. These bots are very famous tools amongst institutional and high-frequency traders. Whether users are a retail trader or an asset manager, now they can add to their trading strategy Cryptohoppers powerful bots to beat the market. The bots are released in Beta and are expected to be fully released on Wednesday the 16th of October. Want to join the Beta? Enable Join Beta Program in your user profile, or ask our Cryptohopper staff members. Create a Cryptohopper account in one minute, connect an exchange or practice with simulated trading and enjoy a free seven-day trial. For more information, visit https://www.cryptohopper.com About Cryptohopper: Cryptohopper offers an automated crypto trading bot; create strategies, or copy others. Cryptohopper is started in September 2017 is considered one of the leading automated trading platforms in the crypto-space. Contact: Henk-Jan Sterenberg +31858769694 press@cryptohopper.com Full article here https://coindoo.com/cryptohopper-introduces-market-making-and-exchange-arbitrage?utm_source=coinschedule
37
« on: October 11, 2019, 12:30:47 pm »
Since Bitcoin (BTC) came into the world back in 2009, the digital asset industry as a whole has grown quite exponentially with the market reaching its apex on the break of 2017-2018. Additionally, in the midst of all this, there has been a rise in the crypto trading sector, with the total capitalization of this domain currently pegged around the $277.90 billion mark.
In its most basic sense, cryptocurrency trading can be compared to forex trading because it allows enthusiasts to purchase digital assets using fiat currencies. Not only that, investors can also choose to make use of a number of strategies in order to increase their returns in the easiest manner possible. In this regard, one of the approaches that has garnered a lot of popularity over the past couple of years is that of investors using Twitter and Google trends data to predict the price movements of digital currencies such as Bitcoin, Ether (ETH), XRP, etc.
Related: Bitcoin Dominance Growing What It Could Mean for Altcoins
On this very subject, The Southern Methodist University, Texas released a study back in 2018. In their report, the researchers were able to establish a clear correlation between the search activity of crypto enthusiasts in relation to BTC and ETH (on Google and Twitter) as well as their active trade values. For example, the report states that there is a link between the price of Bitcoin and the number of tweets associated with the flagship asset preceding a major price change. The researchers then go on to note:
Both Google Trends and tweet volume were highly correlated with price. In addition, the correlation held during periods of increasing and decreasing prices suggest that the relationship is robust to periods of high variance and non-linearity. The findings of our analyses show that sentiment analysis is less effective for cryptocurrency price changes in an environment in which prices are falling. This is because tweets about cryptocurrencies tend to be objective in nature (not having a clear sentiment) or positive regardless of price changes.
With this information in mind, it is worth pointing out that there currently exists a plethora of tools that can be used to gauge the sentiment of the market in relation to the tweets associated with a particular crypto asset. For example, the Crypto Fear and Greed Index as well as CoinTrendz allow users to look at and analyze a number of indicators such as market volatility, online surveys and social media tweets to determine the direction in which the market at large (or even a particular currency) may be heading.
Below are the top cryptocurrencies searched on the day of publication.
Rise of the social media brigade
Since 2015, there has been a massive increase in the number of autonomous analysts who have been providing investors with their insights as to how the future of the market may play out. To provide some perspective as to how popular these solo analysts really are, people like Dan Zanger and Mark Minervini currently have more than 90K followers on Twitter. Similarly, pseudonymous account holders such as CryptoYoda, Zissou and Mocho17 have more than 220K, 124K, 110K online followers respectively.
Cointelegraph got in touch with Bitcoin investor/trader Cryptomelette, whose trading track record so far has been stellar, according to his claims. This is because, at the start of the year, he supposedly had just 1.8 BTC that he then proceeded to grow to a whopping 105 BTC (approximately $1.2 million) using a vast array of investment techniques that he developed by observing a number of other traders.
As with various other famous crypto proponents, Cryptomelette first became interested in Bitcoin around 2013 a period when the preeminent crypto was first starting to gain widespread media prominence. At the time, he says there were a lot of unscrupulous people too eager to give their advice with no skin in the game. However, after sifting through the sand for a few months, he started to follow analysts such as CryptoDonAlt, CryptoCred, VentureCoinist, CryptoTrooper and FilbFilb, who he believes still dole out excellent crypto investment advice. When asked about what drew him to these individuals, Cryptomelette stated:
There are quite a few traders and commentators I follow and look up to but CryptoCred, VentureCoinist, FilbFilb come to mind as standouts not only for their unique and insightful commentary on the market, but also their integrity, which is often in short supply in the crypto world. I never copy anyone blindly, and ultimately I make my own trading decisions which are often at odds with traders I respect.
When asked about the strategies he used to turn over a profit he claims was more than 100 Bitcoins within a period of just six months, he said that his approach to trading was dynamic and that he was constantly tweaking his strategies by understanding the psychological dimensions of the game. He went on to say:
Self mastery, emotional awareness, and the development of a proper attitude are all crucial. The paradoxical ability to be fluid, yet disciplined and systematic is something many traders struggle with and took me a while to fully grasp. The often heard mantra strong opinions, weakly held, captures this beautifully. Having patience has become something of a platitude, but it cannot be overstated. This area of my trading has vastly improved. Other aspects of my trading that have improved my bottom line are the ability to quickly and ruthlessly cut losers, to let winners run, and to focus on the larger time frames (thereby not getting shaken out of good entries due to low time frame noise).
Adaptability and dynamism are essential to trading success
On the subject of continued success and how one can make a living playing the trading game, Cointelegraph also spoke with CryptoYoda a Twitter analyst who in no uncertain terms told us that, in order for a person to succeed in this field, he/she has to dedicate a lot of time and energy to learning the craft. The analyst said:
Research what is it all about, understand why this technology is a global game changer. While you are researching that; find out why the current financial system that we have cannot come to a good end. The information is all out there, it just needs the commitment to dive into it. For those few who are ready, willing and able to dig through those vast amounts of information; you will have a glorious future.
Some of CryptoYodas key tips designed to help budding day traders flourish in this field include:
Invest small, but smart: Buy fractions of Bitcoin every day, week or month no matter how big the amount. If you do so, you have skin in the game, and countless opportunities will be there to multiply your initial investment in the time to come.
Be aware of the market: There will probably be around 10 to 15 blockchainsdominating this space in some years from now. Find those. Keep away from hype and pseudo-decentralized coins.
Prioritize: Data is the most precious asset in today's ever-digitizing world. Buy anon-coins early so you will have the privilege to send money without leaving a trace which will be something that only the crypto-rich will be able to afford.
Get with the times: Learn to trade so you will be ready when the era of investment enters its golden age.
Expand your knowledge base: Start to dabble in coding so that you can create novel offerings within this new decentralized system.
Talking about the most common mistakes he made during the early part of his trading career, CryptoYoda was quick to note that the times he encountered the most financial uncertainty was when he failed to stick to his pre-devised plan of action. He said:
Most common mistakes on my own journey were not sticking to my own analysis/trading plan and entering too early (I tend to be right on direction, but too early in timing). Knowing this alone however makes you observe these particular situations more carefully which in turn is profitable.
So, what lies ahead for the crypto market?
Talking about direction, CryptoYoda believes that the best strategy moving forward is to patiently wait for the emergence of, what he describes as global FOMO. He is of the belief that, when BTC embarks on its next bull run, investors will be able to understand what digital scarcity really means since everybody will be scampering to get their hands on even a fraction of a Bitcoin.
Related: Crypto Bubbles: Why Traders Believe Altcoins Are Overpriced
He also added that, with the legacy financial system facing a lot of stiff competition from emerging blockchain technologies, it is only a matter of time until people start to realize what is really happening and how it will impact their personal lives. According to CryptoYoda:
For the people who are already invested in the space and for those no-coiners thinking about entering crypto for the first time; there could be not a more glorious time. Maybe you refused to buy BTC at 3k and saw it rallying up to 14k, but do not forget: if you missed this boat, there is another train departing soon... Coins other than BTC will have a great time in the future, especially when it comes to coins having anonymity features. Here once again is your chance to sniper the bottom, ride it to global fomo, then sell your bags if you have to. If you do it right, this is the only investment you would ever need to do, but only a few have the guts to actually go for it. That's the game and how it always has been.
On the issue of future-proofness and how one can stay abreast with all of the latest events in the world of crypto, Cointelegraph also spoke with Nicola Duke (aka NicTrades) an independent digital currency specialist who teaches her trading methods via her online Strategy Group. She believes that in order for a person to continually succeed in this field, they need to learn some definitive trend-following strategies so that when prices stop going up, one is sure to make some profit.
Nicola, who has more than 93K followers on Twitter, believes that, owing to the power of the internet, countless information pathways now exist that one can use to make informed investment decisions. She went on to say:
I am not in any Telegram groups and have not tried any so I don't have an opinion. I think it's amazing what you can learn for free on the internet.
The decisions are your own
To conclude, it bears mentioning that most successful day traders seem to be making use of a variety of techniques but specialize in one or two fundamental trading methods. For example. Christopher Inks, CEO and chief strategy officer of TexasWest Capital, said that he makes most of the business decisions based on volume and price action analysis via the Wyckoff Method. However, he also claimed that he frequently incorporates the Elliott Wave Theory to understand larger price movements, as well as supply/demand patterns, and pivots to narrow down price targets.
According to Inks, in order to succeed within this burgeoning space, it is essential that one find a mentor that can help you sift through all the noise and erroneous data that is currently out there. On the subject, Inks added:
Its difficult for new traders to discern between quality analysts and amateurs in this space because the amateurs are often so good at marketing an appearance of knowledge. They tend to give the new traders exactly what those new traders think they want rather than real, actionable analysis.
38
« on: September 22, 2019, 11:24:44 pm »
Williams % R is a very simple but effective is a technical analysis oscillator described by Lary Williams in the year 1973. It measures the capacity of bulls and bears to close price each day near the edge of the recent range. Williams % R confirms the trend and gives us a warning of the upcoming reversal. Williams % R gives us 3 types of trading signal. They are as follows- 1. It defines the overbought and oversold zone 2. It defines failure swings 3. It identifies bullish and bearish divergence We will discuss two special strategies using Williams % R. Trading strategy using Williams% R and Moving Average This is a simple but very effective strategy using which we can get good buy or sell signal. Here we just combine Williams % R and 100-period moving average to generate trading signals. This strategy works very well in case of volatile stocks. Case 1: When the price closes below the 100 DMA and the Williams % R is below the 50 line, a short signal is generated. We will remain in the trade until the Williams % R gives a closing above 50 line and the price closes above 100 DMA. In the first scenario, as we can see in the chart, that when the price closes below the 100 DMA and the Williams % R was also below the 50 line, we could have taken a short trade. However, when the Williams % R crossed back above the 50 line, we could book our trade, thus making a fair amount of profit in the process. 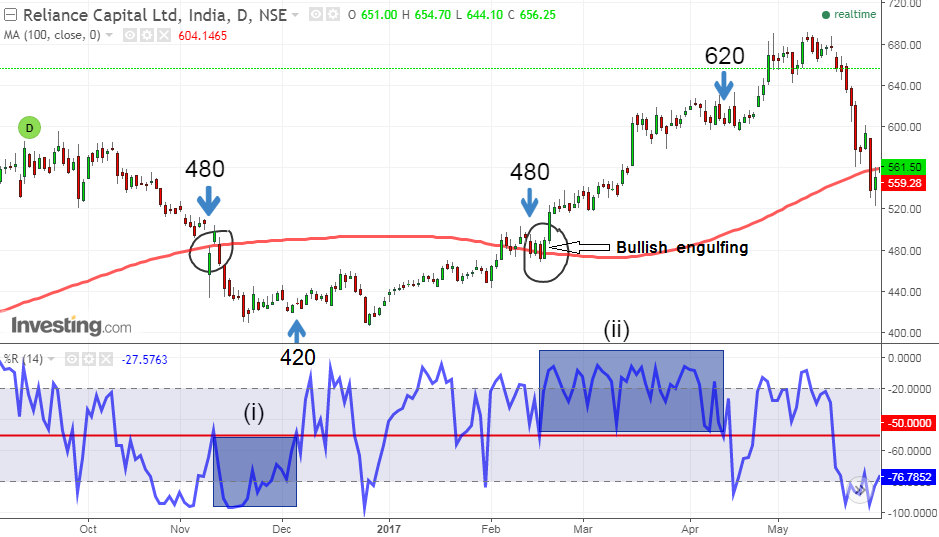 Case 2: When the price closes above 100-period moving average, from below, and the Williams % R is above the 50 line, a buy signal is generated. We will be there in the trade unless the Williams % R gives a closing below 50 line or the price closes below the 100 DMA. In the second scenario, we saw that as the price closed above the 100 DMA and as long the Williams % R is above the 50 line, we could remain in the trade. However, when the Williams % R closed below the 50 line, we could have exited the trade. This trade could give us very good profit. Taking early entry in reversal trades, based on multiple time frames In the above chart, we have seen the indications in the daily time frame. In order to get an early signal, you may trade using multiple time frames. Say if you look into the daily chart to take your position, you may look into smaller time frame say hourly or 2-hourly chart to get a better entry. However, if you are a day trader, you may combine your hourly chart with that of the 5-minute chart. Lets take an example to understand this in more detail- For example, in the below chart you can see that there was an overbought condition (marked as a circle) in the daily chart of Havells India as on 16th May 2017. Next day (17th May) when the Williams % R came down from the upper reference line, it generated a sell signal. A trader who takes a trade based on daily chart would have entered in the trade either on 17th May (when Williams % R turned down) or 18th May (due to the formation of a bearish engulfing pattern on the daily chart). 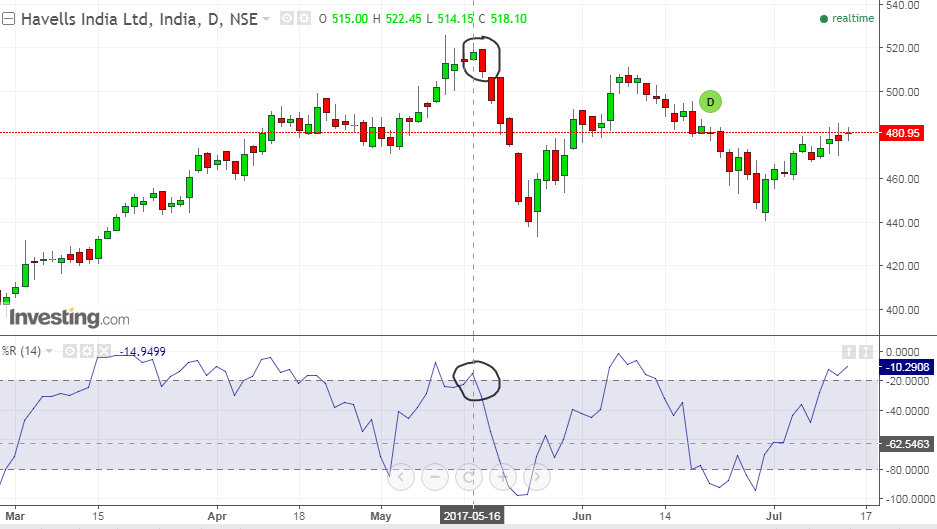 Now lets have a look at the smaller time frame (2-hourly chart in our example) to have more clarity on our trade. According to this chart, a trader would have made his/her position as on 16th May 2017 at around 12 pm. This gives us a much early signal as compared to the daily chart where the sell signal was received either on 16th or 17th May. 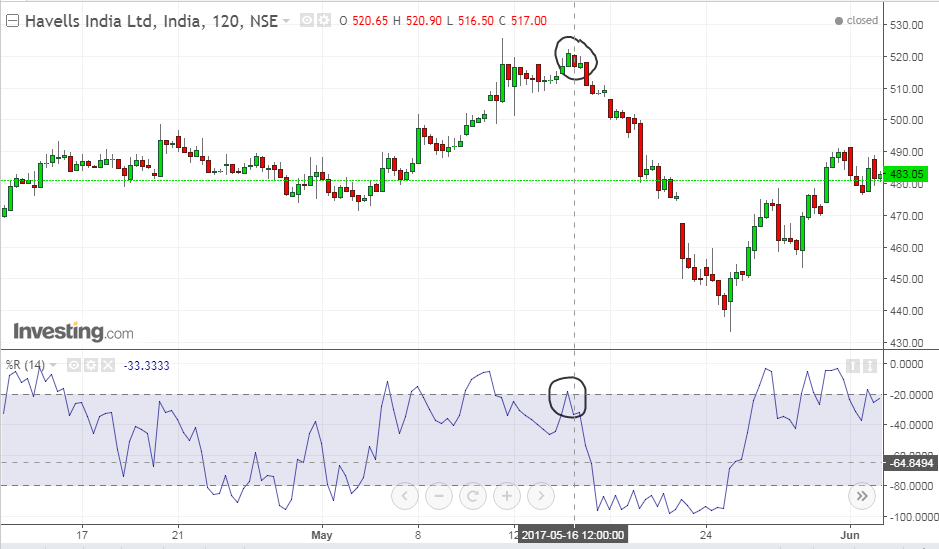 Bottomline Like other technical indicators, Williams %R should also be used in conjunction with other technical analysis tools like chart patterns, volume, and breakouts, which can be used to get confirmed signals produced by Williams %R. Become an expert at spotting and analyzing technical cues with Kredent Academy & Elearnmarkets Technical Analysis course. This course will teach you the skills needed to capitalize on trends like a professional trader using advanced technical indicators and complex chart analysis Original post here: https://www.elearnmarkets.com/blog/trading-strategies-using-williams-r/
39
« on: September 21, 2019, 07:21:44 pm »
40
« on: September 21, 2019, 12:42:24 pm »
41
« on: September 21, 2019, 12:06:26 pm »
42
« on: September 21, 2019, 11:46:24 am »
43
« on: September 20, 2019, 11:47:10 pm »
 In this post we will discuss about building a trading strategy using R. Before dwelling into the trading jargons using R let us spend some time understanding what R is. R is an open source. There are more than 4000 add on packages,18000 plus members of LinkedIns group and close to 80 R Meetup groups currently in existence. It is a perfect tool for statistical analysis especially for data analysis. The concise setup of Comprehensive R Archive Network knows as CRAN provides you the list of packages along with the base installation required. There are lot of packages available depending upon the analysis needs to be done. To implement the trading strategy, we will use the package called quantstrat. Four Step Process of Any Basic Trading Strategy Hypothesis formation Testing Refining Production Our hypothesis is formulated as market is mean reverting. Mean reversion is a theory that suggests that the prices eventually move back to their average value. The second step involves testing the hypothesis for which we formulate a strategy on our hypothesis and compute indicators, signals and performance metrics. The testing phase can be broken down into three steps, getting the data, writing the strategy and analyzing the output. In this example we consider NIFTY-Bees. It is an exchange traded fund managed by Goldman Sachs. NSE has huge volume for the instrument hence we consider this. The image below shows the Open-High-Low-Close price of the same. We set a threshold level to compare the fluctuations in the price. If the price increases/decreases we update the threshold column. The closing price is compared with the upper band and with the lower band. When the upper band is crossed, it is a signal for sell. Similarly when the lower band is crossed, it is a signal for sell. The coding section can be summarized as follows, Adding indicators Adding signals Adding rules A helicopter view towards the output of the strategy is given in the diagram below. Thus our hypothesis that market is mean reverting is supported. Since this is back-testing we have room for refining the trading parameters that would improve our average returns and the profits realized. This can be done by setting different threshold levels, more strict entry rules, stop loss etc. One could choose more data for back-testing, use Bayseian approach for threshold set up, take volatility into account. Once you are confident about the trading strategy backed by the back-testing results you could step into live trading. Production environment is a big topic in itself and its out of scope in the articles context. To explain in brief this would involve writing the strategy on a trading platform. As mentioned earlier, we would be building the model using quantstrat package. Quantstrat provides a generic infrastructure to model and backtest signal-based quantitative strategies. It is a high-level abstraction layer (built on xts, FinancialInstrument, blotter, etc.) that allows you to build and test strategies in very few lines of code. The key features of quantstrat are, Supports strategies which include indicators, signals, and rules Allows strategies to be applied to multi-asset portfolios Supports market, limit, stoplimit, and stoptrailing order types Supports order sizing and parameter optimization In this post we build a strategy that includes indicators, signals, and rules. For a generic signal based model following are the objects one should consider, Instruments- Contain market data Indicators- Quantitative values derived from market data Signals- Result of interaction between market data and indicators Rules- Generate orders using market data, indicators and signals. Without much ado lets discuss the coding part. We prefer R studio for coding and insist you use the same. You need to have certain packages installed before programming the strategy. The following set of commands installs the necessary packages. install.packages("quantstrat", repos=" http://R-Forge.R-project.org") install.packages("blotter", repos=" http://R-Forge.R-project.org") install.packages("FinancialInstrument", repos=" http://R-Forge.R-project.org") Once you have installed the packages you import them for further usage. require(quantstrat) Read the data from csv file and convert it into xts object. ym_xts <- as.xts(read.zoo("Path//Data.csv",sep = "," , header=TRUE,format = "%m/%d/%Y %H:%M", tz="")) NSEI<-ym_xts We initialize the portfolio with the stock, currency, initial equity and the strategy type. stock.str='NSEI' # stock we trying it on currency('INR') stock(stock.str,currency='INR',multiplier=1) initEq=1000 initDate = index(NSEI[1])#should always be before/start of data #Declare mandatory names to be used portfolio.st='MeanRev' account.st='MeanRev' initPortf(portfolio.st,symbols=stock.str, initDate=initDate) initAcct(account.st,portfolios='MeanRev', initDate=initDate) initOrders(portfolio=portfolio.st,initDate=initDate) Add position limit if you wish to trade more than once on the same side. addPosLimit(portfolio.st, stock.str, initDate, 1, 1 ) Create the strategy object. stratMR <- strategy("MeanRev", store = TRUE) We build a function that computes the thresholds are which we want to trade. If price moves by thresh1 we update threshold to new price. New bands for trading are Threshold+/-Thresh2. Output is an xts object though we use reclass function to ensure. THTFunc<-function(CompTh=NSEI,Thresh=6, Thresh2=3){ numRow<- nrow(CompTh) xa<-coredata(CompTh)[,4] xb<-xa tht<-xa[1] for(i in 2:numRow){ if(xa >(tht+Thresh)){ tht<-xa}
if(xa<(tht-Thresh)){ tht<-xa}
xb<-tht
}
up <- xb + Thresh2
dn<- xb-Thresh2
res <- cbind(xb, dn,up)
colnames(res) <- c("THT", "DOWN", "UP")
reclass(res,CompTh)
}
Add the indicator, signal and the trading rule.
stratMR <- add.indicator(strategy = stratMR, name = "THTFunc", arguments = list(CompTh=quote(mktdata), Thresh=0.5, Thresh2=0.3), label='THTT')
stratMR<-add.signal(stratMR,name="sigCrossover",arguments= list(columns=c("Close","UP"),relationship="gt"),label="Cl.gt.UpperBand")
stratMR<-add.signal(stratMR,name="sigCrossover",arguments= list(columns=c("Close","DOWN"),relationship="lt"),label="Cl.lt.LowerBand")
stratMR <- add.rule(stratMR,name='ruleSignal', arguments = list(sigcol="Cl.gt.UpperBand",sigval=TRUE, prefer = 'close', orderqty=-1, ordertype='market', orderside=NULL, threshold=NULL,osFUN=osMaxPos),type='enter')
stratMR <- add.rule(stratMR,name='ruleSignal', arguments = list(sigcol="Cl.lt.LowerBand",sigval=TRUE, prefer = 'close', orderqty= 1, ordertype='market', orderside=NULL, threshold=NULL,osFUN=osMaxPos),type='enter')
start_t<-Sys.time()
Run the strategy and have a look at the order book.
out<-try(applyStrategy(strategy=stratMR , portfolios='MeanRev') )
# look at the order book
getOrderBook('MeanRev')
end_t<-Sys.time()
Update the portfolio and view the trade statistics
updatePortf('MeanRev', stock.str)
chart.Posn(Portfolio='MeanRev',Symbol=stock.str)
tradeStats('MeanRev', stock.str)
View(t(tradeStats('MeanRev')))
.Th2 = c(.3,.4)
.Th1 = c(.5,.6)
require(foreach)
require(doParallel)
registerDoParallel(cores=2)
stratMR<-add.distribution(stratMR,paramset.label='THTFunc',component.type= 'indicator',component.label = 'THTT',
variable = list(Thresh = .Th1),label = 'THTT1')
stratMR<-add.distribution(stratMR,paramset.label='THTFunc',component.type= 'indicator',component.label = 'THTT',
variable = list(Thresh2 = .Th2),label = 'THTT2')
results<-apply.paramset(stratMR, paramset.label='THTFunc', portfolio.st=portfolio.st, account.st=account.st, nsamples=4, verbose=TRUE)
stats <- results$tradeStats
View(t(stats))
Here is the complete code
require(quantstrat)
ym_xts <- as.xts(read.zoo("~/webinar//N1.csv",sep = "," , header=TRUE,format = "%m/%d/%Y %H:%M", tz=""))
NSEI<-ym_xts
colnames(NSEI)<-c("Open","High","Low","Close")
stock.str='NSEI' # stock we trying it on
currency('INR')
stock(stock.str,currency='INR',multiplier=1)
initEq=1000
initDate = index(NSEI[1])#should always be before/start of data
portfolio.st='MeanRev'
account.st='MeanRev'
initPortf(portfolio.st,symbols=stock.str, initDate=initDate)
initAcct(account.st,portfolios='MeanRev', initDate=initDate)
initOrders(portfolio=portfolio.st,initDate=initDate)
addPosLimit(portfolio.st, stock.str, initDate, 1, 1 ) #set max pos
stratMR <- strategy("MeanRev", store = TRUE)
THTFunc<-function(CompTh=NSEI,Thresh=6, Thresh2=3){
numRow<- nrow(CompTh)
xa<-coredata(CompTh)[,4]
xb<-xa
tht<-xa[1]
for(i in 2:numRow){
if(xa>(tht+Thresh)){ tht<-xa}
if(xa<(tht-Thresh)){ tht<-xa}
xb<-tht
}
up <- xb + Thresh2
dn<- xb-Thresh2
res <- cbind(xb, dn,up)
colnames(res) <- c("THT", "DOWN", "UP")
reclass(res,CompTh)
}
stratMR <- add.indicator(strategy = stratMR, name = "THTFunc", arguments = list(CompTh=quote(mktdata), Thresh=0.5, Thresh2=0.3), label='THTT')
stratMR <- add.signal(stratMR,name="sigCrossover",arguments = list(columns=c("Close","UP"),relationship="gt"),label="Cl.gt.UpperBand")
stratMR <- add.signal(stratMR,name="sigCrossover",arguments = list(columns=c("Close","DOWN"),relationship="lt"),label="Cl.lt.LowerBand")
stratMR <- add.rule(stratMR,name='ruleSignal', arguments = list(sigcol="Cl.gt.UpperBand",sigval=TRUE, prefer = 'close', orderqty=-1, ordertype='market', orderside=NULL, threshold=NULL,osFUN=osMaxPos),type='enter')
stratMR <- add.rule(stratMR,name='ruleSignal', arguments = list(sigcol="Cl.lt.LowerBand",sigval=TRUE, prefer = 'close', orderqty= 1, ordertype='market', orderside=NULL, threshold=NULL,osFUN=osMaxPos),type='enter')
start_t<-Sys.time()
out<-try(applyStrategy(strategy=stratMR , portfolios='MeanRev') )
getOrderBook('MeanRev')
end_t<-Sys.time()
updatePortf('MeanRev', stock.str)
chart.Posn(Portfolio='MeanRev',Symbol=stock.str)
tradeStats('MeanRev', stock.str)
View(t(tradeStats('MeanRev')))
.Th2 = c(.3,.4)
.Th1 = c(.5,.6)
require(foreach)
require(doParallel)
registerDoParallel(cores=2)
stratMR<-add.distribution(stratMR,paramset.label='THTFunc',component.type = 'indicator',component.label = 'THTT', variable = list(Thresh = .Th1),label = 'THTT1')
stratMR<-add.distribution(stratMR,paramset.label='THTFunc',component.type='indicator',component.label = 'THTT', variable = list(Thresh2 = .Th2),label = 'THTT2')
results <- apply.paramset(stratMR, paramset.label='THTFunc', portfolio.st=portfolio.st, account.st=account.st, nsamples=4, verbose=TRUE)
stats <- results$tradeStats
View(t(stats))
Next Step
Once you are familiar with these basics you could take a look at how to start using quantimod package in R. Or in case youre good at C++, take a look at an example strategy coded in C++.
If youre a retail trader or a tech professional looking to start your own automated trading desk, start learning algo trading today! Begin with basic concepts like automated trading architecture, market microstructure, strategy backtesting system and order management system.
Original post with more details and links https://www.r-bloggers.com/quantitative-trading-strategy-using-r-a-step-by-step-guide/
44
« on: September 20, 2019, 03:44:22 pm »
45
« on: September 12, 2019, 07:38:18 am »
|

